Accurate modeling and monitoring are essential to success in a Passive House project. Data plays a vital role in validating architectural and engineering decisions, confirming the functionality of systems, and identifying areas for potential improvements.
After renovating our iconic King’s Block building in New Haven to passive house standards, we started monitoring the Energy Usage Intensity (EUI) on a monthly basis,
Achieving Phius certification for our project involved several stages of design and construction, including installing photovoltaics on the roof to offset significantly reduced energy demands. We discuss the historic Passive House design and construction of our first Passive House project in 2 previous articles.
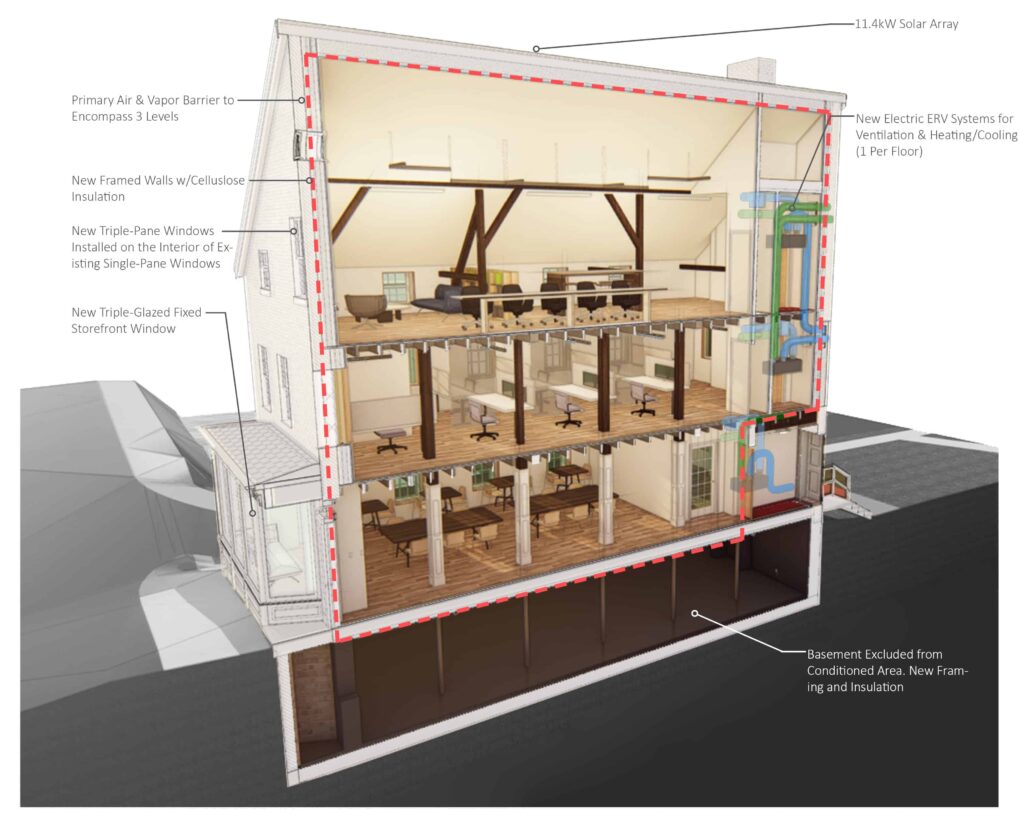
Essentially, our three-story historic masonry building acts as one whole building for the thermal envelope and air tightness, but each floor has its own mechanical system to heat, cool, and provide fresh air to the roughly 1,100-square-foot floor plates. We thermally disconnected the basement and stairwells from the rest of the building to limit the volume of conditioned air and to provide resiliency by removing the potential for flooding of essential equipment in the basement.
Our goal of Phius certification was achieved over numerous steps – in design and construction – including installing photovoltaics on the roof to offset our drastically reduced energy loads.
Understanding Energy Loads
A key part of the process of passive building design is modeling the projected energy loads for the building. Using WUFI software, we input all the major components’ energy loads, including mechanical systems, kitchen appliances, and plug loads (any equipment plugged into sockets).
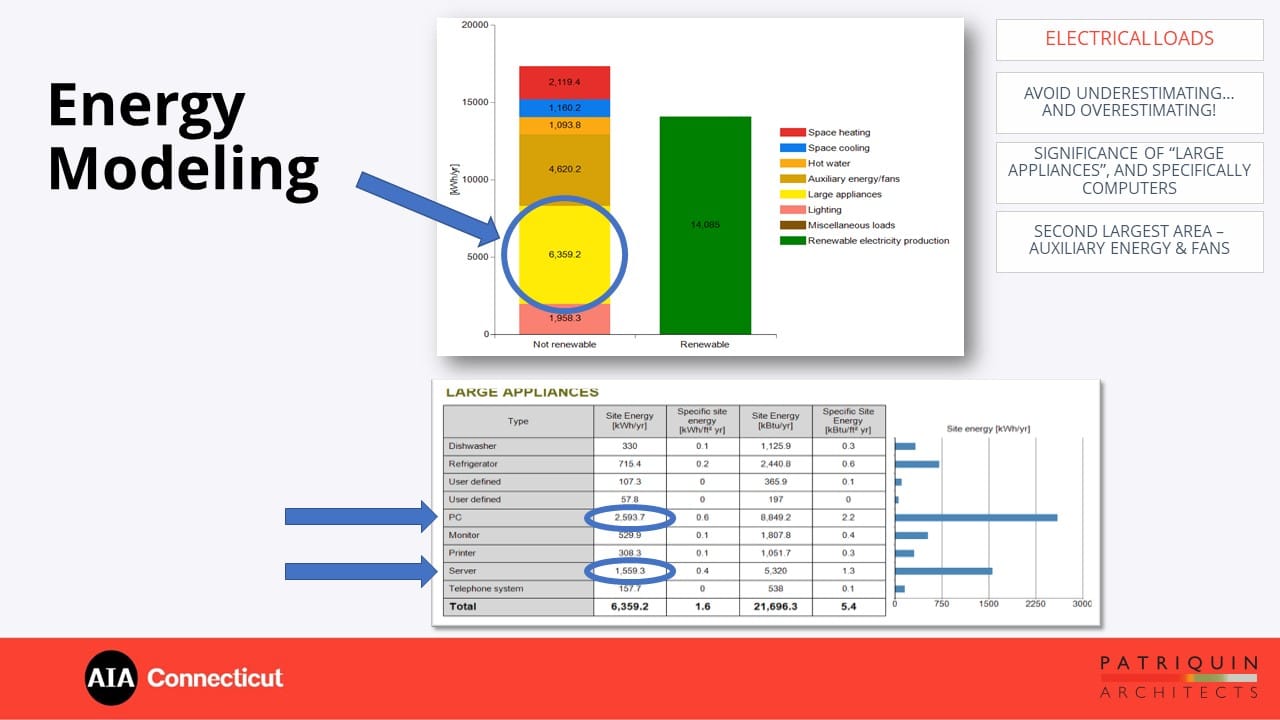
We found that the energy used for the building’s mechanical systems is the highest draw – including space heating, space cooling, and auxiliary energy/fans. The next category is “large appliances,” which, in the case of office use is less about the kitchen appliances than our computers, screens, and servers. Any new equipment we now buy is carefully researched to use the least energy possible.
Calculating & Offsetting Energy Usage
Modeling the building’s volume and upgraded envelope components (roof, exterior walls, floors, and windows/doors), we calculated the projected energy usage for our 3-story historic building.

Phius’ Passive House benchmarks include heating and cooling demands, heating and cooling loads, and source energy caps. We found that we could meet all of these except source energy, meaning we needed to produce power on-site to achieve our overall goals. Based on the size and orientation of our roof, we predicted that we could install an 11.4 kW rooftop solar array which would produce approximately 76% of the energy we would be using in our building.
Energy Monitoring – Findings
The investment in time, effort, and expense paid off when months of data analysis revealed that we were using less energy than predicted, and our building’s energy production surpassed the modeled amount. This has resulted in an excellent energy use intensity (EUI), a measure of the building’s energy performance relative to its floor area.
Now for the specific numbers and how we found them.
Energy use intensity (EUI) = Energy consumed by the building / total floor area of the building. Units are kBtu/sq.ft./year.
For a building where we are also producing energy, we can calculate the net EUI which is:
EUI Net: (Energy consumed – energy produced) / total floor area of the building.
1. Energy Consumed: your Electric Bill
Data is available on your utility company’s portal. You can usually find information over a long period of time (a year) or delve into daily consumption. It is worth getting to know the patterns of your usage. Here is the energy consumption data for the worst and best months for energy consumption – January and May. These graphs also show the average outside temperature for each day.
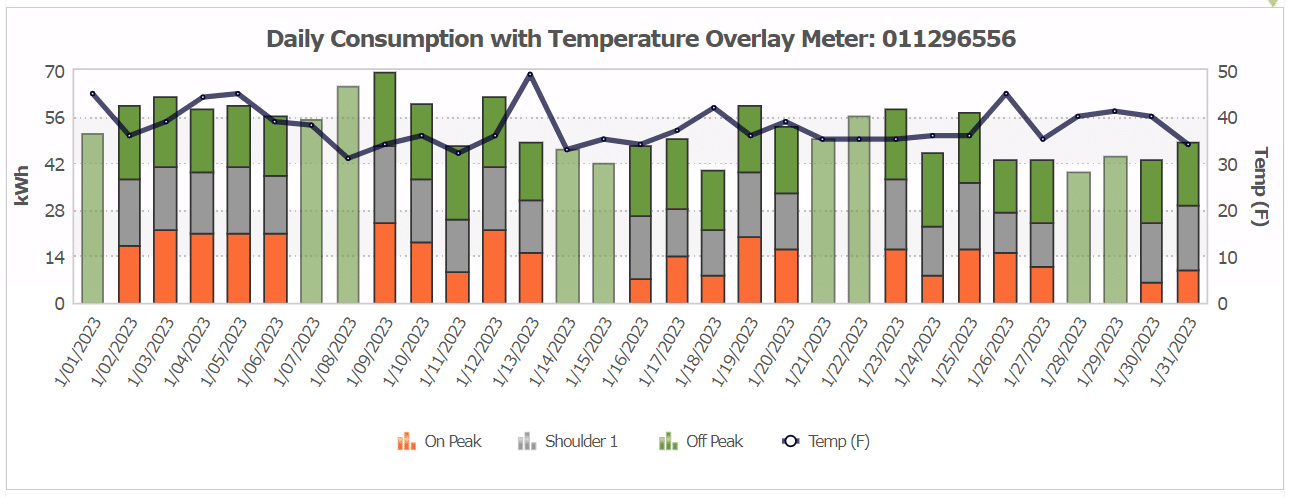
Energy usage for January – the coldest month of the year
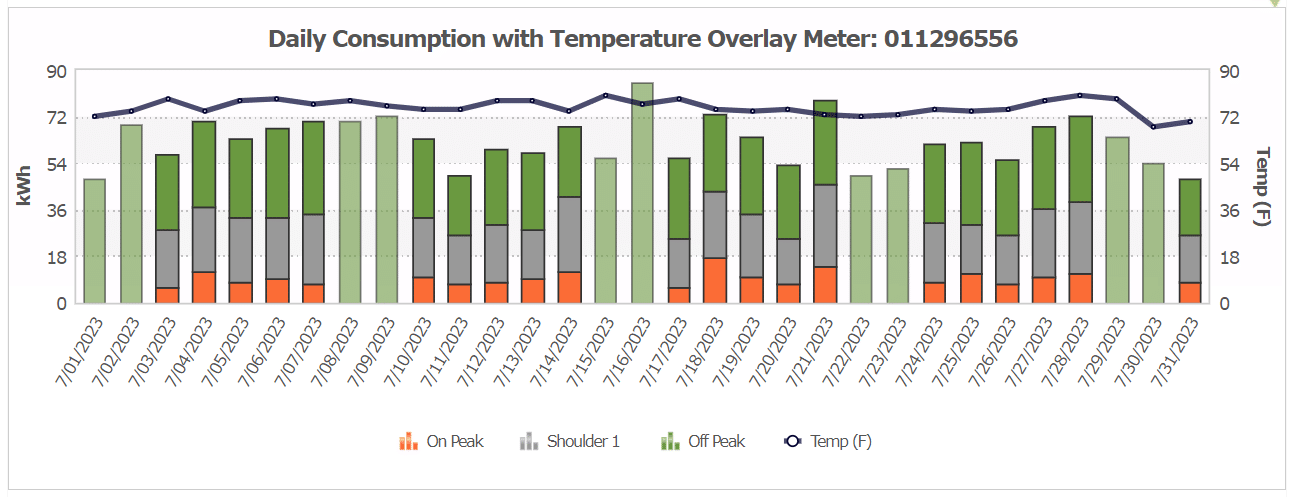
Energy usage in July – the hottest month of the year
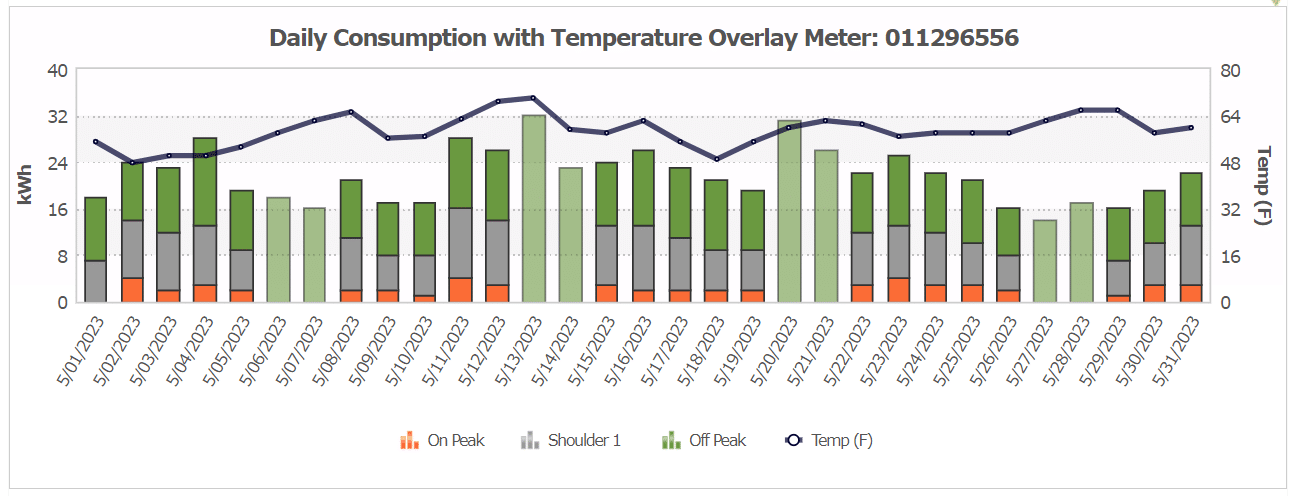
Energy usage in the shoulder month of May – the month the least energy is used
2. Energy Produced – your Solar Company’s Portal
This energy graph shows production over the entire year. You can see the highest production this year was in May and June, the least in December and January.

There is a huge range of energy produced from close to 0 on a snowy day to 73.2 kWh on the sunniest day
There is also a physical plan of the array which shows the amount of energy each individual panel produces. On our array, there is a chimney near the top left which produced a shadow over the area in the afternoon, resulting in lower production values there.
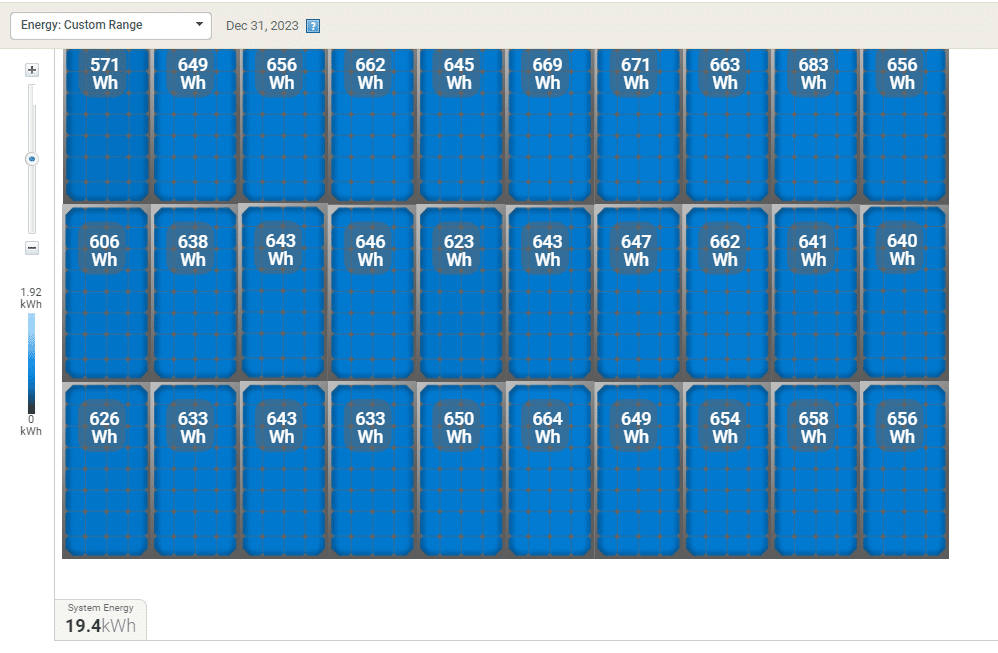
Plan view of our solar array
3. Putting It All Together
Putting our information together on one graph, you can see in blue the energy used in the building, peaking in July and January with lows in April and May; in orange the energy produced by our solar array with the high in May and the lows in December and January. The energy we are using is not necessarily in sync with the timing of energy produced. This is why we calculate a net amount of energy over the period of a year.
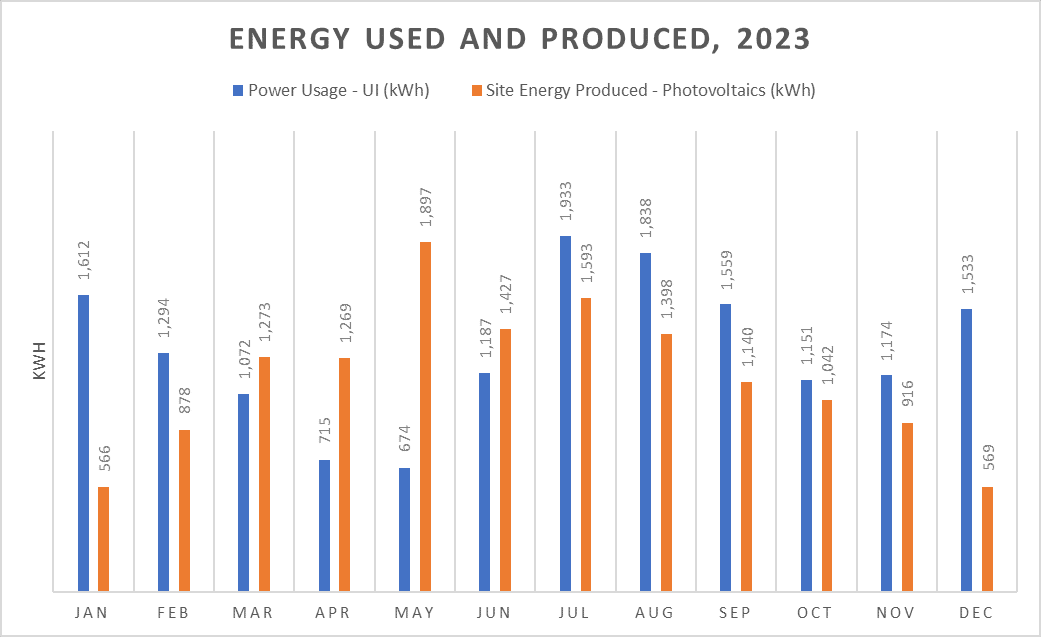
Energy used is not in sync with energy produced.
Our final numbers:
THE MODELED NUMBERS
Energy Required: 18,520 kWh /yr
Energy Produced: 13,155 kWh/yr
Total Area (conditioned space over 3 floors): 4,040 SF
EUI: 15.64 kBTU/SF/yr
EUI(net): 4.53 kBTU/SF/yr
THE MEASURED NUMBERS (12 MONTHS)
Energy Used: 43.13kWh per day or 15,742 kWh per year
Energy Produced: 38.27 kWh per day or 13,968 kWh per year
Total Area (conditioned space over 3 floors): 4,040 SF
EUI: 13.3 kBTU/SF/Yr
EUI(net): 1.5 kBTW/SF/Yr
We produce 89% of the energy we use.
The Many Benefits of Historic Building Passive House Renovations
Implementing Passive House principles in renovating historic structures yields numerous benefits for owners, occupants, communities, and the environment. Reduced energy consumption translates to lower operational costs, enhanced sustainability, and reduced environmental impact. Further, it improves the building’s structural integrity, aesthetic appeal, and market value while preserving its historical significance for future generations.
If you have questions about our King’s Block project, the services we provide, or our firm in general, please get in touch with us at your convenience.